
API development is complex by nature, shaped by multiple tightly interdependent variables. Small shifts in temperature, reaction time, or mixing speed can cascade into meaningful changes elsewhere in the process, ultimately affecting yield, consistency and product quality.
Quality by design (QbD) offers a framework for managing this complexity by building quality into the manufacturing process from the start. Rather than relying on end-stage testing alone, QbD begins by defining the desired product profile, identifying the critical quality attributes (CQAs) required to achieve it, and establishing appropriate operating ranges for the critical process parameters (CPPs) that influence performance.
At the core of the QbD lifecycle are structured studies designed to clarify the relationships between different attributes. By systematically evaluating variability, validating hypotheses and translating observations into control strategies, scientific teams can move from process uncertainty to process confidence.
In this whitepaper, we explore the practical application of QbD principles using real-world data from a multi-step API synthesis. We examine how the Sterling team identified stage-specific CQAs, determined the CPPs most likely to influence them and applied design of experiments (DoE) to define proven acceptable ranges (PARs) that support robust, reproducible outcomes.
Defining target specifications and associated CQAs
To ensure quality from the outset of a project, it is crucial to first identify the target quality characteristics. The Quality Target Product Profile (QTPP) defines the target specifications of an API that must be achieved to ensure the optimal safety and efficacy of the final product. QTPPs are established based on regulatory requirements, route of administration, dosage form, clinical context and other relevant factors.
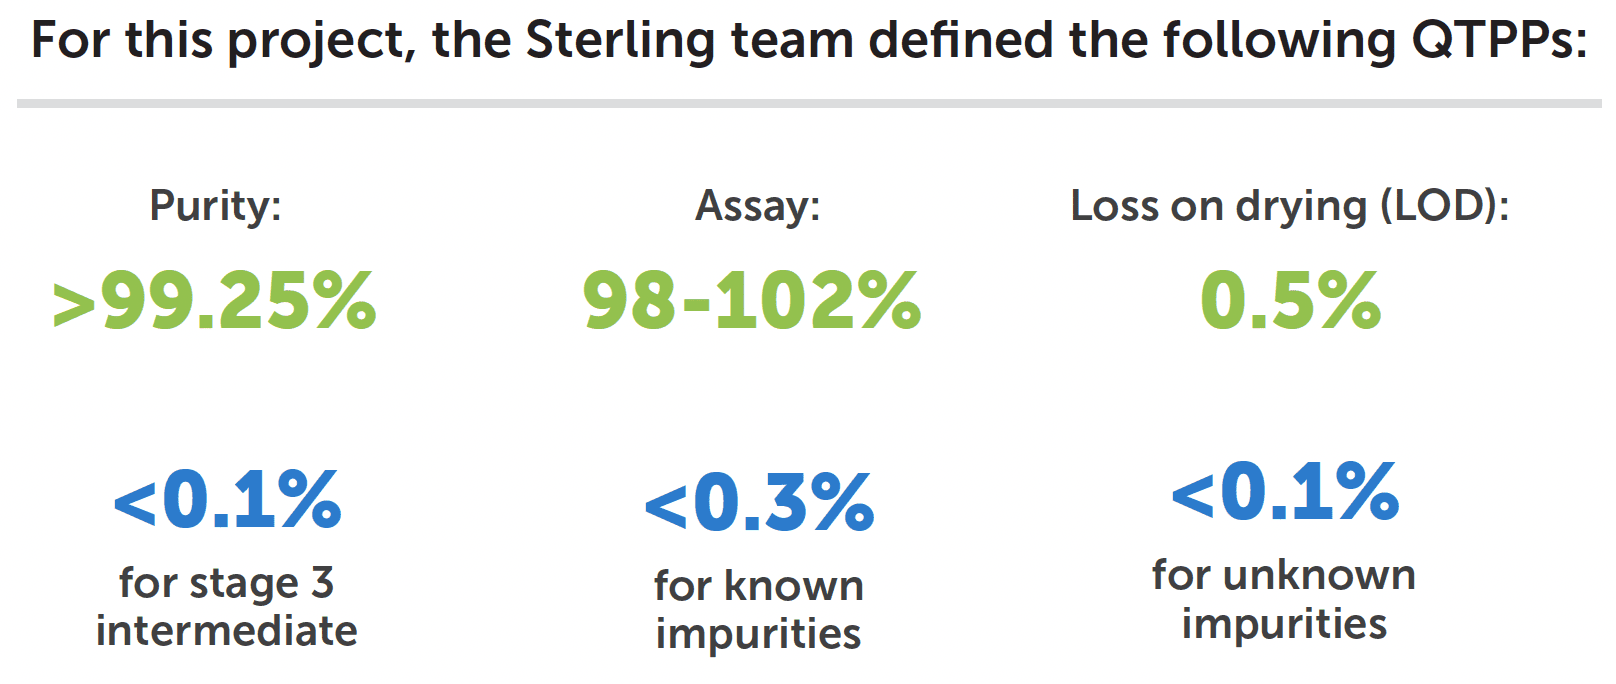
Based on these specifications, the team identified the CQAs that most directly influenced these outcomes as purity, assay, and residual solvents and water.
Next, the team defined appropriate limits for these attributes, informed by a comprehensive understanding of process behaviour and safety profiles. Process development and fate and purge studies, together with safety assessments such as micro reaction calorimetry (μRC) and differential scanning calorimetry (DSC), supported the establishment of the following CQA limits
- >99.5% purity for stage 3 intermediate after crystallisation
- Crude stage 3 purity of >80% stage 3 intermediate and <5% stage 2 intermediate
After establishing CQAs and appropriate limits, the team turned to DoE to examine CPPs and their relationships to CQAs
Identifying CPPs through DoE
To identify the CPPs, the team developed a comprehensive process flow diagram outlining each unit operation, separating the reactions, work-up stages and two recrystallisations. Scale-up experiments were conducted to confirm the safety and reproducibility of each step. Using this process map, the team identified where each CQA was introduced or affected and determined which CPPs were associated with each stage.
From there, DoE studies were performed to understand the sensitivity of key parameters and the impact of their variation on reaction performance. DoE was critical in enabling effient evaluation of parameter interactions, rather than assessing variables independently in isolation.
Parameters reviewed included the following?
- +5% variation in KOAc (potassium acetate)
- +10% variation in I2, K2S2O8, AcOH
- Temperatures at 55°C, 65°C, 75°C
- Reaction times of 18h and 42h
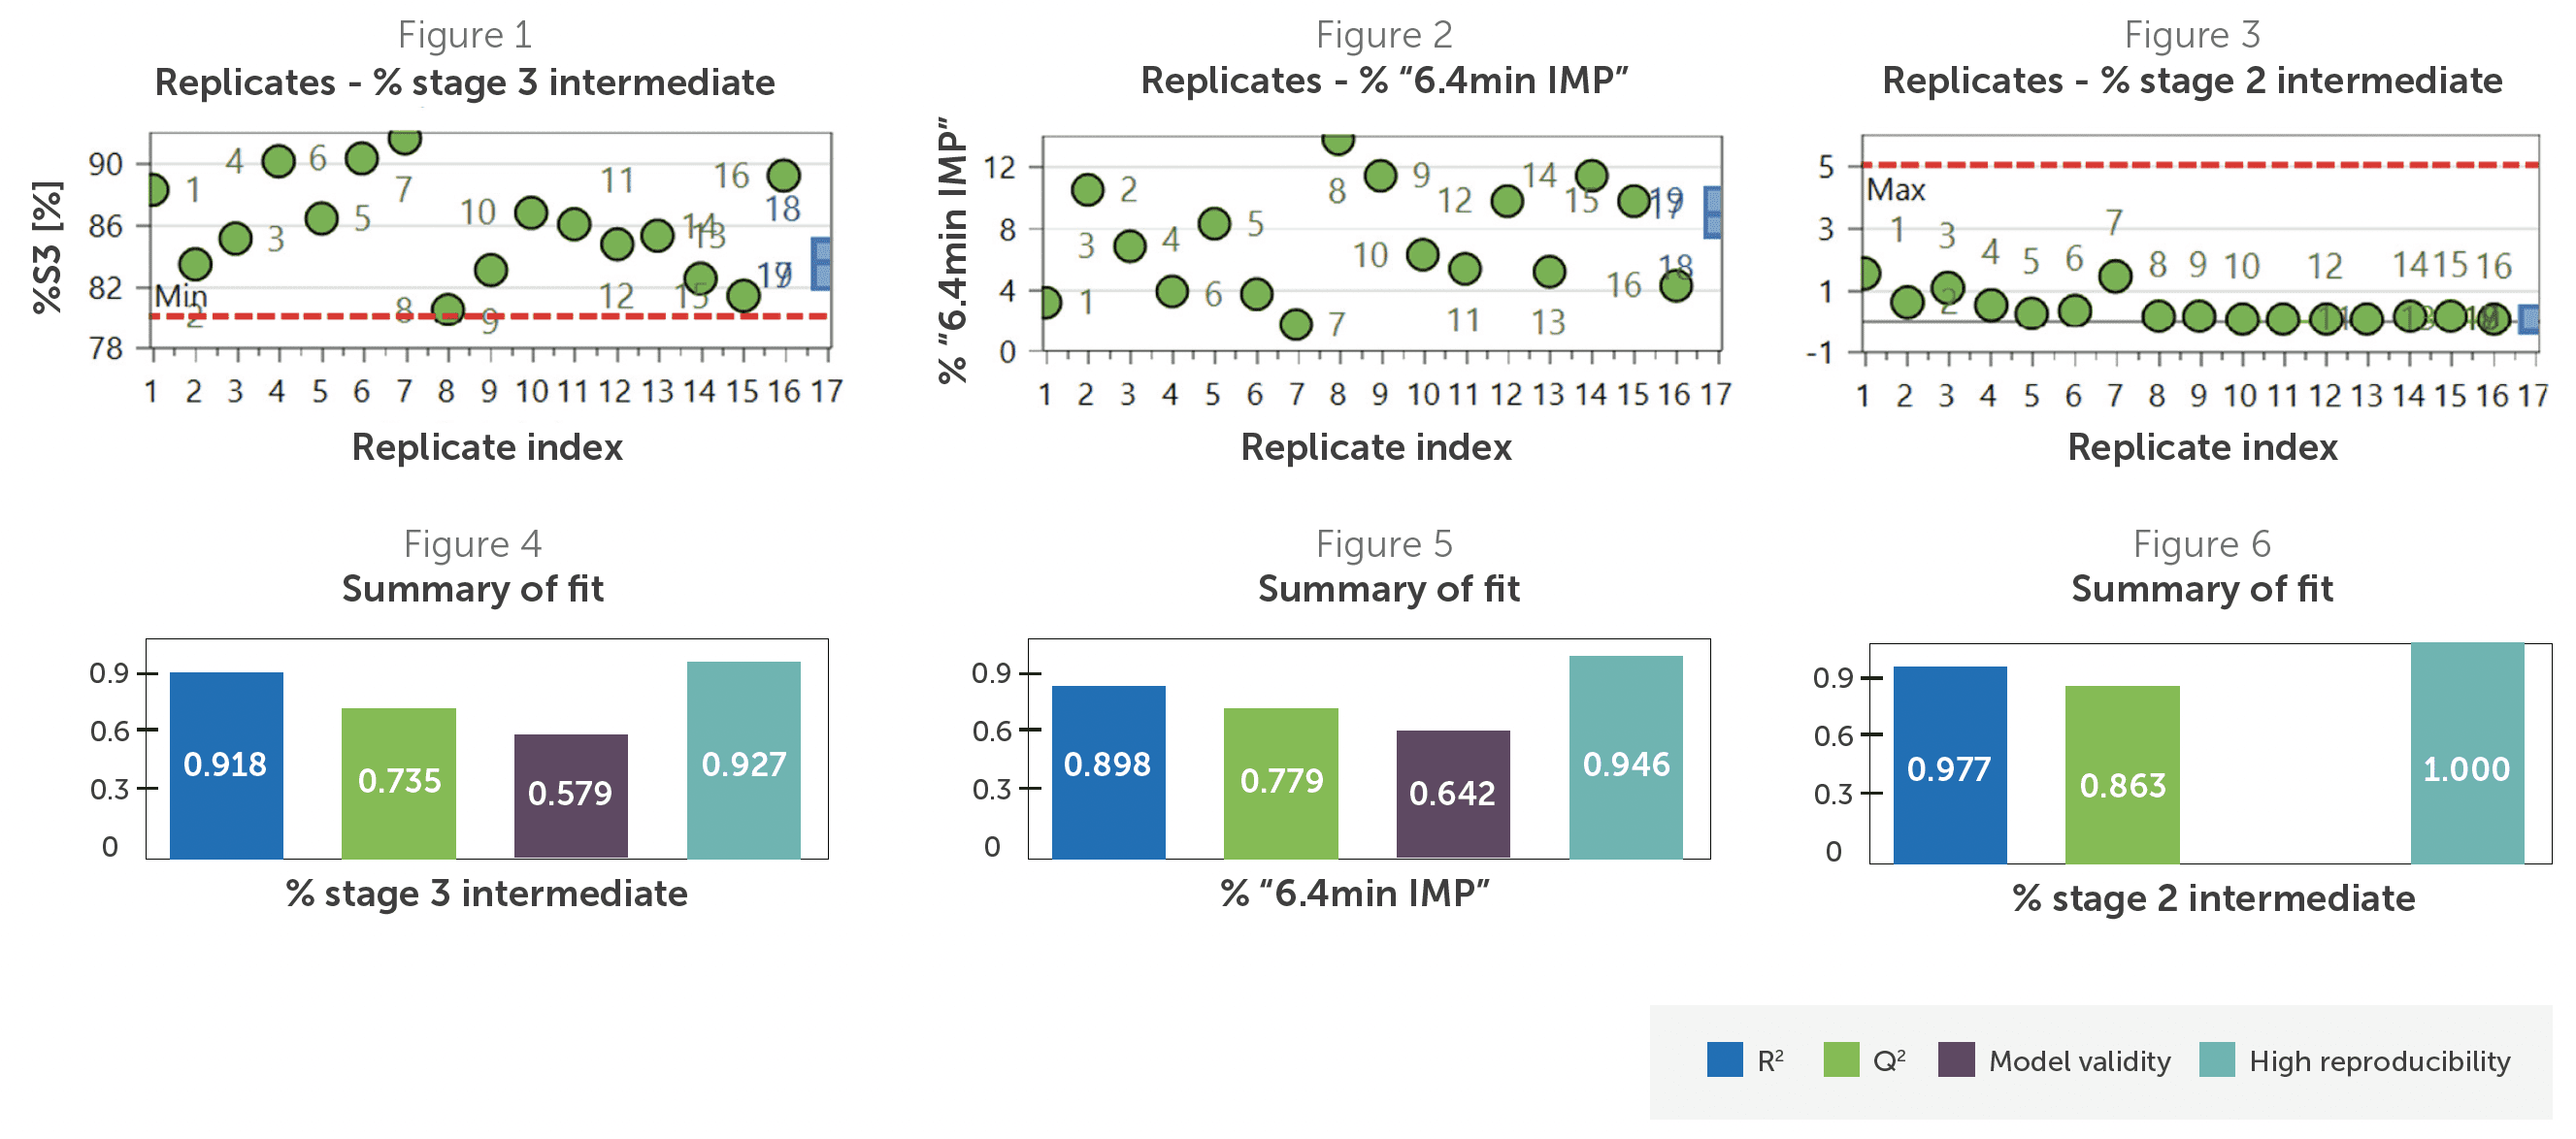
DoE allowed the team to systematically vary key parameters and quantify their impact on stage 3 intermediate purity, residual stage 2 starting material and concentration of an unidentified impurity.
Understanding model fit and CPP-CQA relationships
To ensure that the DoE model accurately captured the relationship between CPPs and CQAs, the team used replicate plots and summaries of fit. The replicate plots showed lower variability and high reproducibility among center-point experiments relative to the overall variability. R2 ranged from 0.918-0.977, confirming strong model fit, while Q2 ranged from 0.735-0.863 (Figures 4 and 6), confirming predictive reliability.
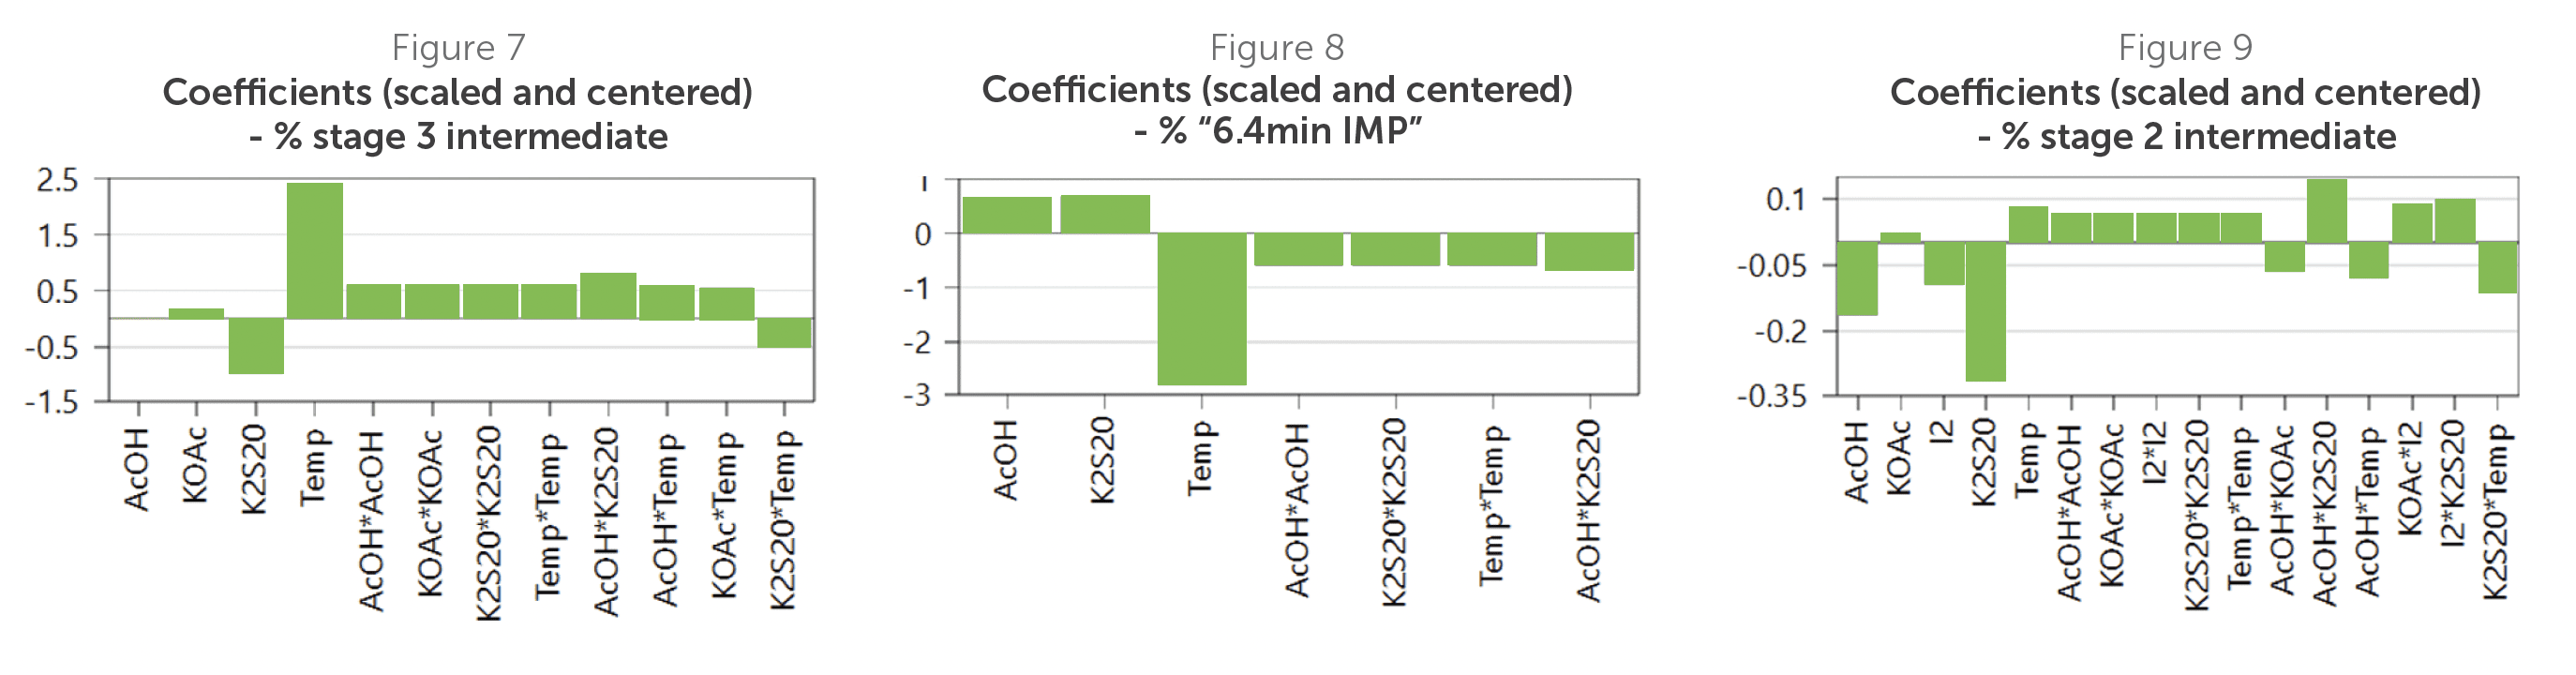
Then, the team reviewed coefficient plots, which showed the main factors and secondary interactions from the DoE model. Each plot shows how changes in factors impact a particular CQA. From these plots, temperature emerged as a clear CPP. Higher temperatures improved stage 3 yield (Figure 7) and reduced the unidentified impurity (Figure 8).
A contour plot for % stage 3 intermediate (Figure 10) then allowed the team to further refine parameters and visualise where the desired purity was achieved.
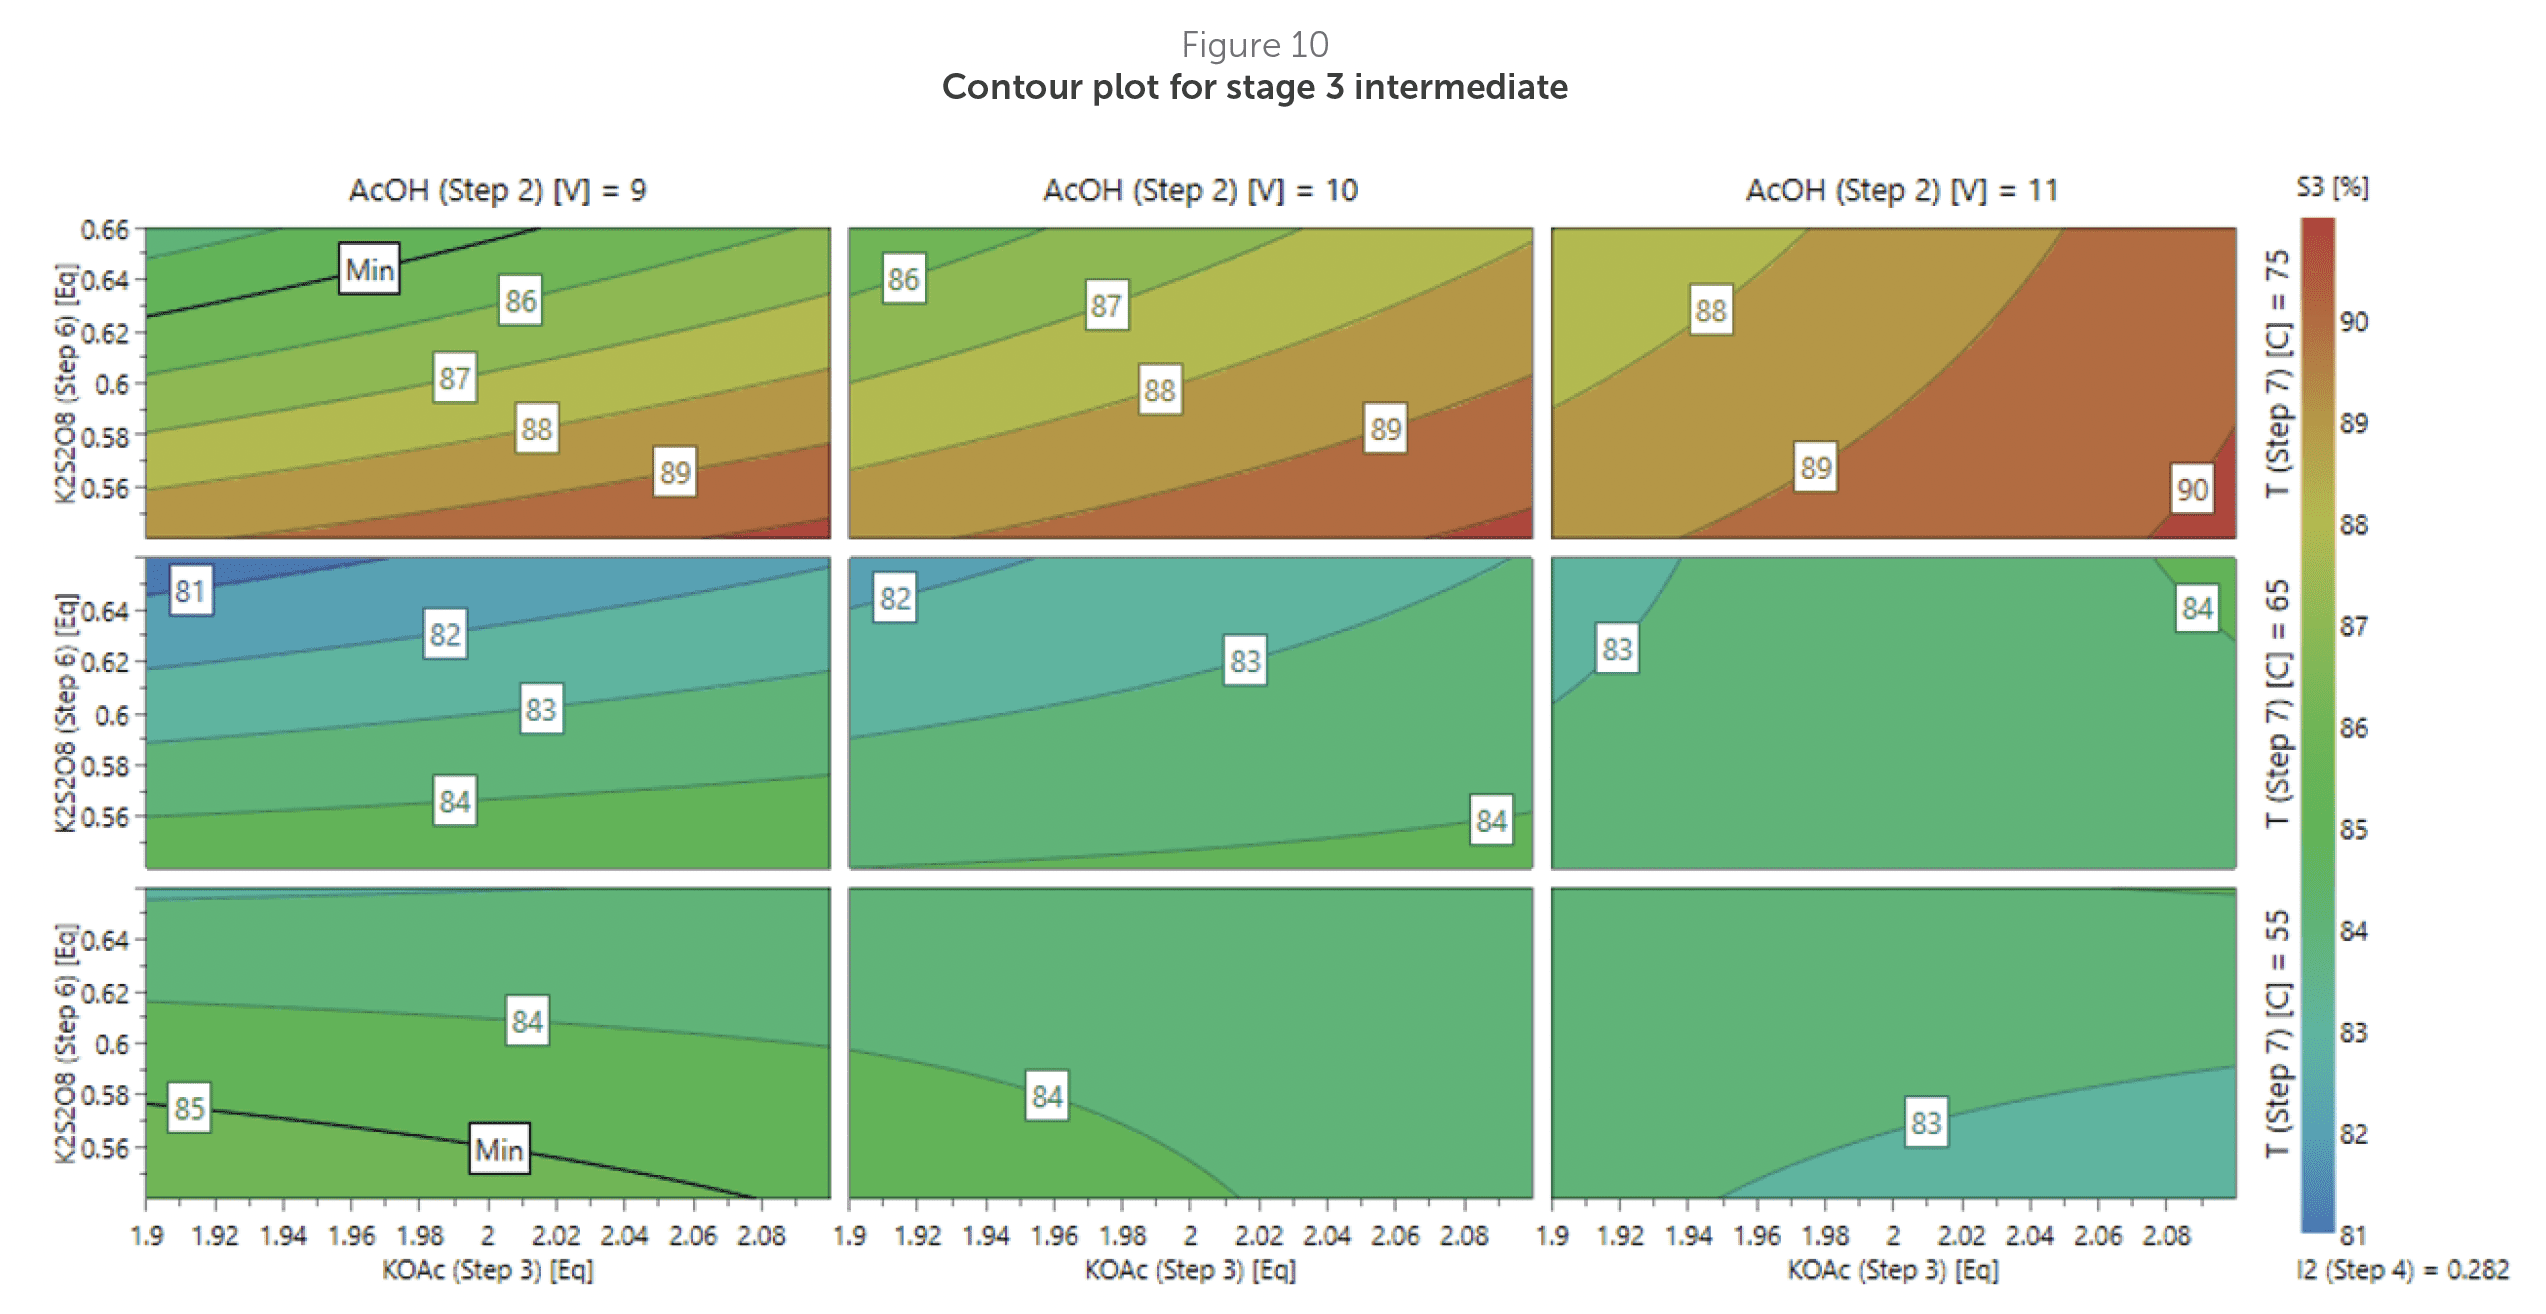
As temperature emerged as the dominant CPP based on this analysis, the team then focused on designing practical operating limits through PAR studies.
Establishing optimal reaction conditions with PAR studies
Building on the statistical models from DoE, the team then conducted PAR studies to translate model predictions into practical operating limits. While DoE had identified temperature as the primary CPP, PAR studies were essential to defining where that parameter would consistently deliver the highest product quality under real-world conditions.
These studies examined the relationships between temperature and key quality attributes including stage 3 conversion, impurity formation and residual stage 2 material.
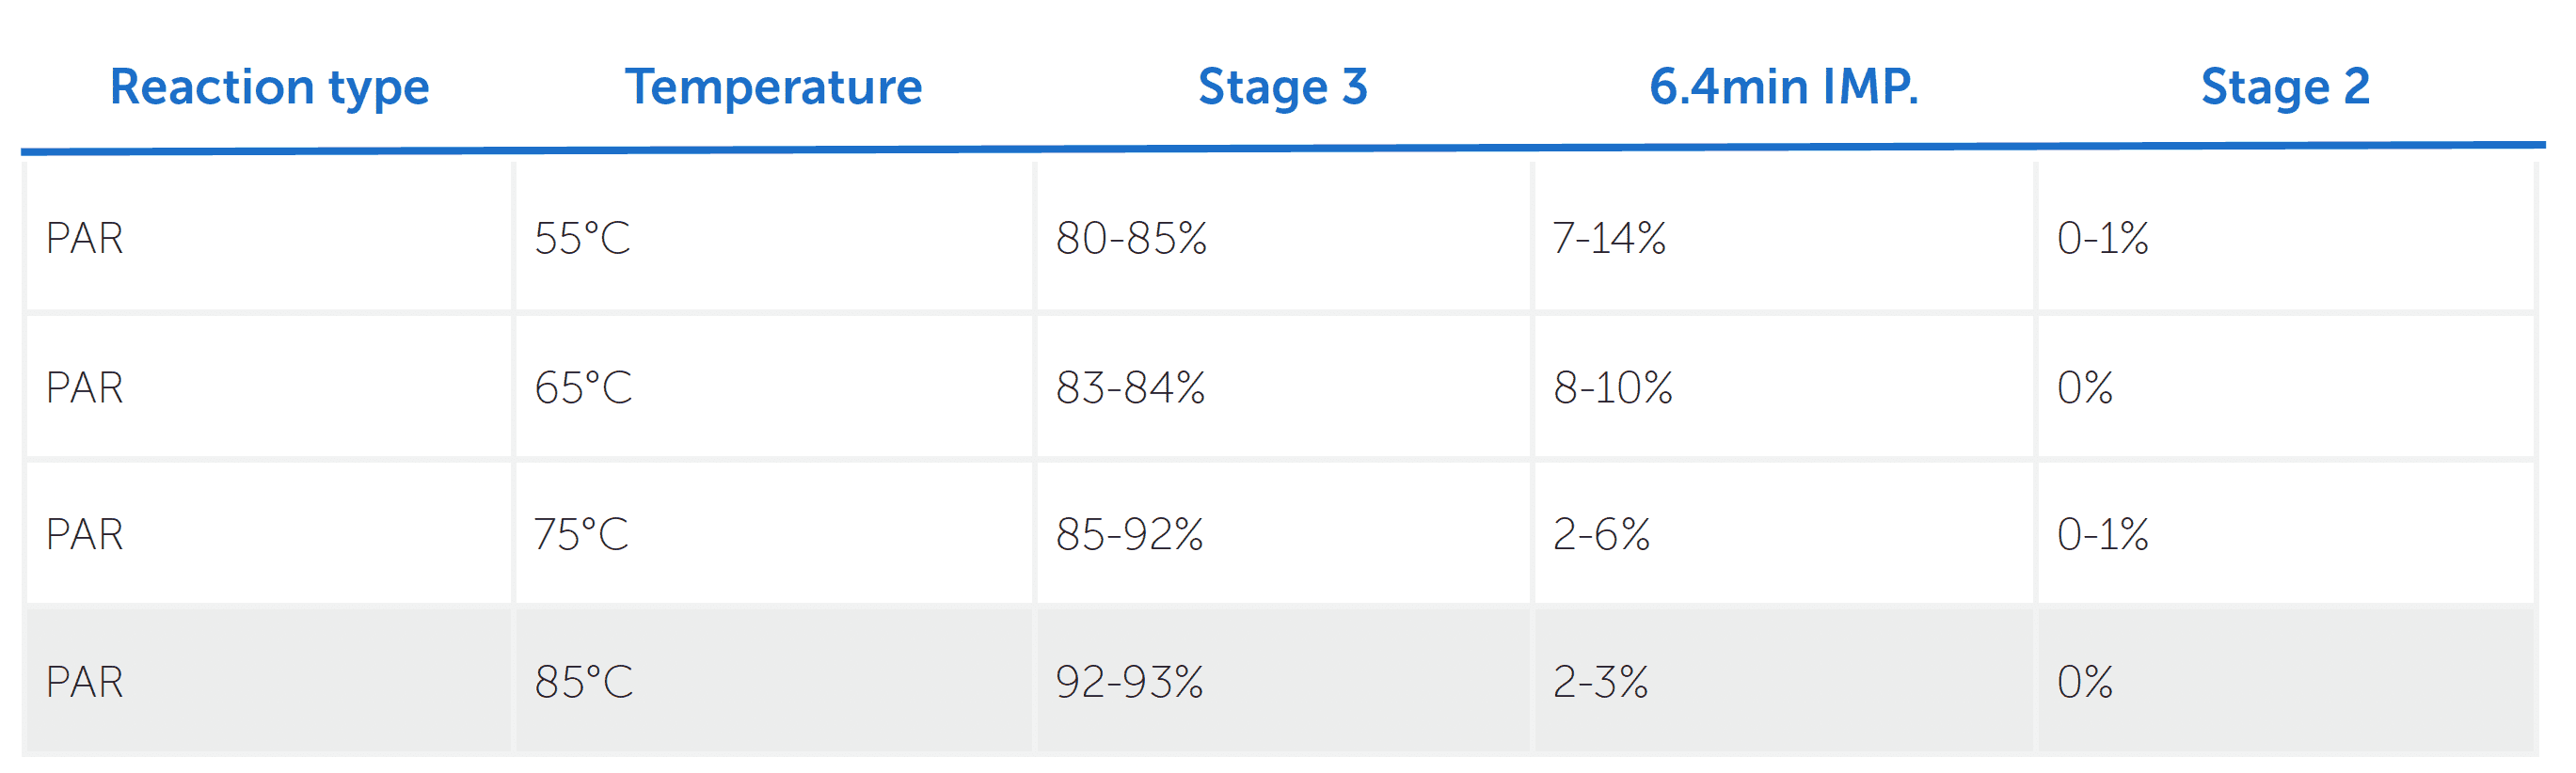
This data demonstrated a clear trend. Increased temperature significantly improved reaction conversion while simultaneously reducing impurity formation and residual starting material. At the same time, temperatures nearing 100°C would risk decomposition of K2S2O8, so it was important for the acceptable operating window to balance reaction performance with stability and safety.
To further assess this balance, micro reaction calorimetry was performed at 85°C, which appeared to be the optimal temperature. This showed an acceptable 440J/g of heat generated over 100 minutes. Importantly, this temperature maintained very low impurity levels within safe thermal limits.
Beyond chemical performance, the team also evaluated engineering considerations. In the stage 1 reaction, reduced solvent concentration caused mixing limitations, establishing solvent volume as a CPP from an engineering standpoint. This reinforced the importance of bringing engineering and chemical considerations together for truly robust process design.
Conclusion
This case study demonstrates how a structured, data-driven QbD approach enables confident and controlled process development. By applying DoE to identify critical process parameters and using PAR studies to confirm acceptable operating ranges, the team established a robust and well-characterised manufacturing process.
By building this depth of process understanding from the outset, the Sterling team achieved a high-purity product supported by well-documented and scalable operating conditions. Ultimately, this illustrates the true value of QbD. When scientific understanding is embedded at every stage of development, robust process performance and consistent product quality are engineered by design.